
Surge Components Inc: FY2025 Revenue Recovery and Operating Income Growth
Surge Components Inc posted a significant rebound in revenue and operating income in fiscal 2025, while cash flow generation declined amid heightened capital expenditures.
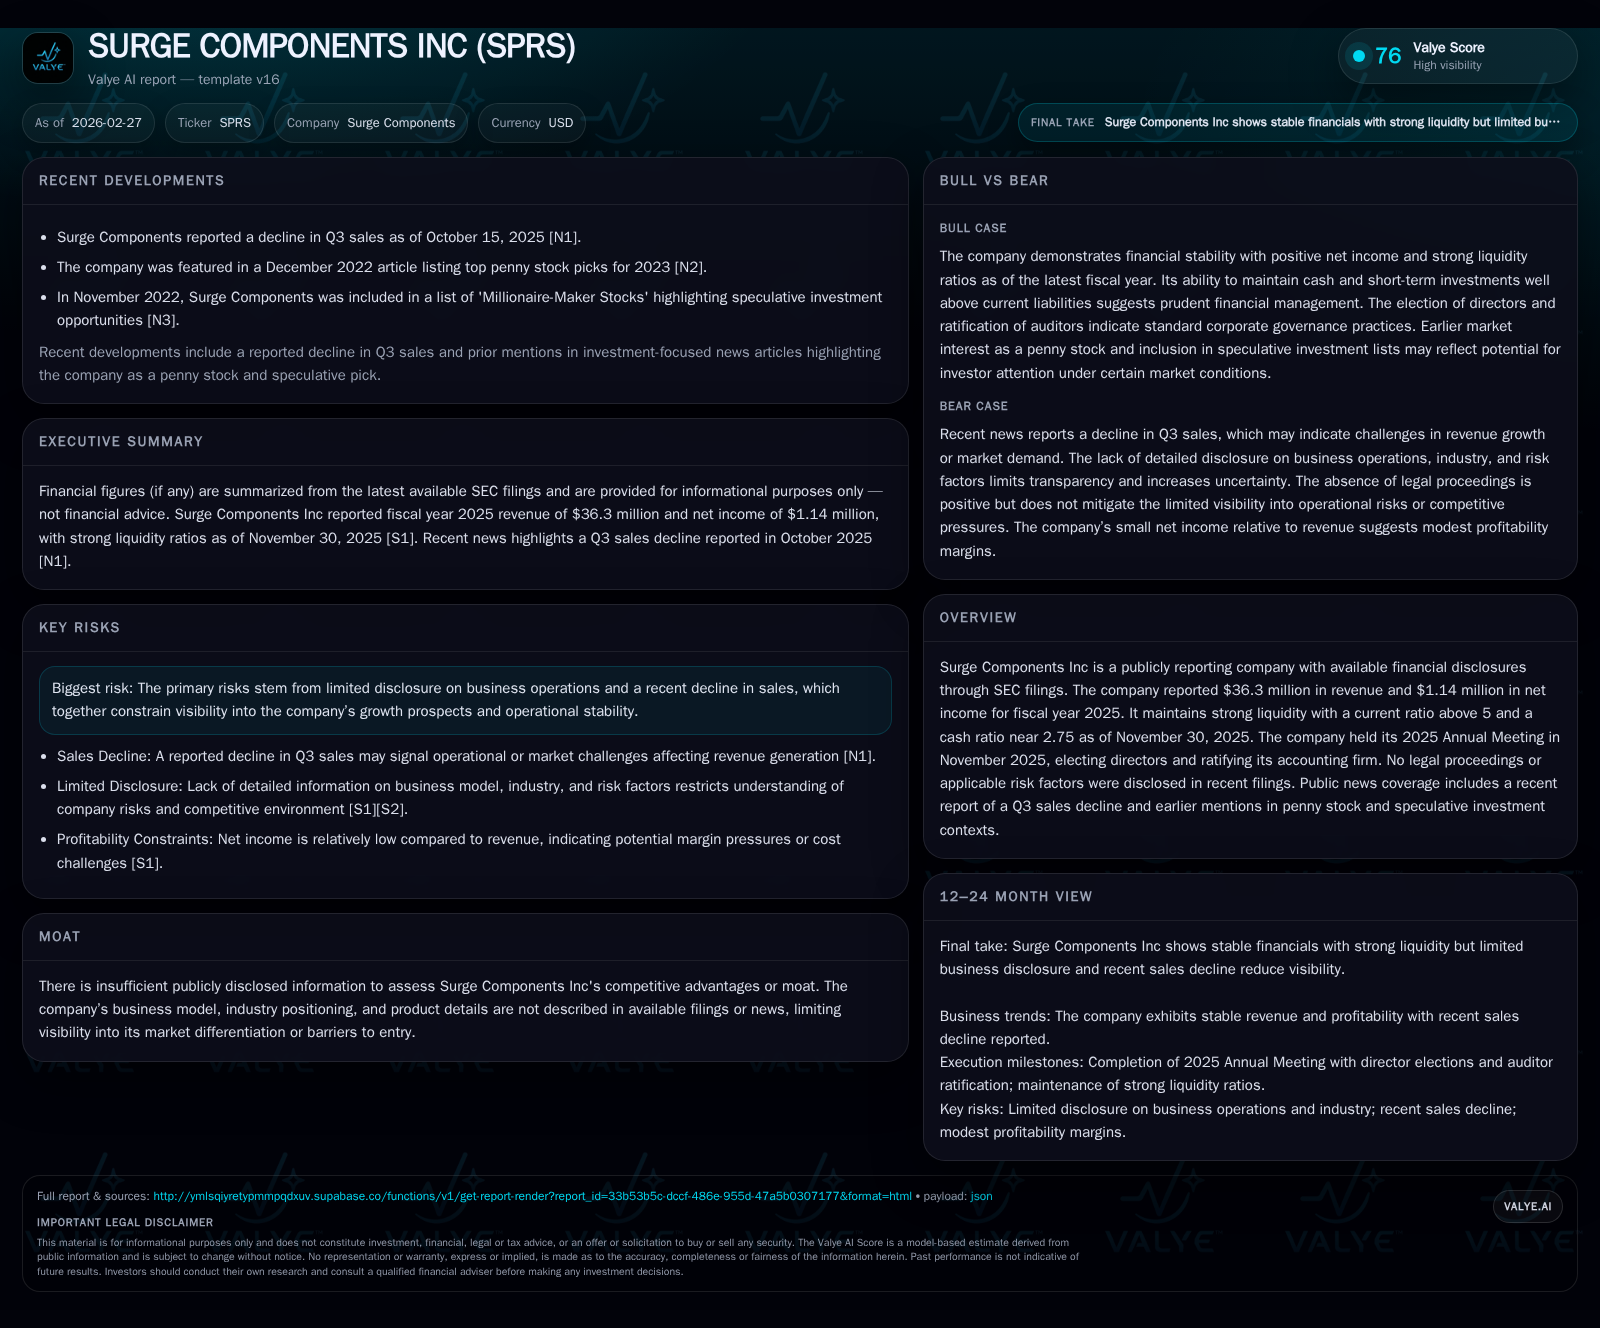
In FY2025, Surge Components Inc reversed prior revenue softness with a 16.4% increase to $36.3 million and drove operating income higher by 38.8% to $1.25 million, reflecting improved operational efficiency. Net income rose 37.7% to $1.14 million. However, operating cash flow declined sharply by nearly 50% to $916K, highlighting working capital pressures despite strong liquidity supported by a current ratio above 5. Capital expenditures surged over tenfold to $122K, underscoring reinvestment efforts amid no recent dividends or share repurchases. Equity expanded to $21.4 million with a modest return on equity of approximately 5.3%. Limited segment disclosure and absence of forward guidance constrain outlook clarity, emphasizing the need to monitor quarterly financial trends for sustained operational momentum [F1],[S1],[S10].
Financial Performance Overview: FY2023–FY2025
Surge Components Inc experienced a volatile but improving financial performance over the last three fiscal years ending November 30, 2025 [F1]. After revenue declined from $36.28 million in FY2023 to $31.21 million in FY2024 (-13.9%), the company rebounded strongly in FY2025 with revenue rising 16.4% year-over-year to $36.32 million.
Operating income followed suit, increasing from $903,947 in FY2024 to $1,254,402 in FY2025 (+38.8%), indicative of enhanced operating leverage or margin recovery despite lack of segment detail [F1],[S1]. Net income also improved significantly by 37.7%, reaching $1,136,713.
However, operating cash flow fell sharply by nearly half (-49.8%) year-over-year from approximately $1.82 million in FY2024 down to $916,147 in FY2025 [F1]. This divergence between accrual earnings growth and declining cash generation points toward potential working capital build or other quality-of-earnings considerations warranting further attention.
Historical performance (annual)
| FY | Rev ($mm) | Net ($mm) | CFO ($mm) | OpInc ($mm) | Rev YoY | Net YoY |
|---|---|---|---|---|---|---|
| 2025 | 36 | 1 | 1 | 1 | +16.4% | +37.7% |
| 2024 | 31 | 1 | 2 | 1 | -14.0% | -15.1% |
| 2023 | 36 | 1 | 2 | 2 | -74.0% | |
| 2022 | 4 | 2 | 5 |
Source: SEC companyfacts cache [F1].
Capital returns and efficiency (annual)
| FY | FCF ($mm) | ROE% |
|---|---|---|
| 2025 | 1 | 5.3 |
| 2024 | 2 | 4.2 |
| 2023 | 2 | 5.2 |
| 2022 | 2 | 21.3 |
Source: SEC companyfacts cache [F1].
Table: Select Annual Financial Metrics for Surge Components Inc (FY2023-FY2025) sourced from [F1]
Operational Drivers and Margin Expansion
The filings do not provide detailed breakdowns by product lines or geography ([S1],[S5]), limiting insight into specific growth drivers behind the revenue rebound and operating margin improvement.
The company reported no material legal proceedings or regulatory risks ([S3],[S4]), suggesting operational factors primarily drove recent profitability gains.
Liquidity and Working Capital Position
Surge Components maintained strong liquidity as of November 30, 2025 with current assets totaling approximately $25.78 million against current liabilities near $5.01 million – yielding a current ratio around 5.14 [F1]. Cash and equivalents stood at roughly $5.33 million.
Despite this liquidity strength, the steep drop in operating cash flow suggests working capital absorption possibly due to inventory or receivables increases linked to sales growth.
Capital Allocation: Absence of Shareholder Returns Amid Reinvestment
Equity increased by about $2.9 million during FY2025 reaching approximately $21.4 million [F1], reflecting retained earnings accumulation.
Capital expenditures rose markedly from roughly $11K in FY2024 to nearly $122K in FY2025 (+1009%), indicating reinvestment likely aimed at capacity or technology enhancements [F1].
No dividends or share repurchases have been reported since at least FY2016 [F1],[S10], consistent with a conservative approach toward capital returns focused on supporting growth initiatives.
Return on equity was approximately 5.3%, calculated as net income divided by shareholders’ equity at fiscal year-end – modest but improving alongside profitability gains [F1].
Outlook Considerations
Limited disclosure on business segments and absence of forward guidance ([S1],[S10]) constrain visibility into Surge Components’ future growth prospects.
Investors should prioritize monitoring quarterly revenue trends and operating cash flow dynamics for indications of sustainable operational improvement.
Enhanced transparency regarding customer concentration or end-market exposure would aid evaluation but is currently unavailable.
This analysis is based solely on publicly available SEC filings and company disclosures without extrapolation beyond reported data.
Disclaimer: This is research-only, informational analysis and not investment advice. It may include AI-generated interpretation and general industry context. Always verify important details using primary sources.
Comments