
Latham Group’s Strategic Levers: Fiberglass Adoption, Dealer Capacity, and the Stakes of Market Concentration
Latham Group, Inc. leverages its leading North American pool manufacturing footprint, digital marketing, and dealer network to drive growth, but remains exposed to macro demand swings, dealer concentration, and product-specific constraints. Recent acquisitions and a $100 million share buyback highlight capital allocation and expansion priorities as the company navigates both opportunity and risk.
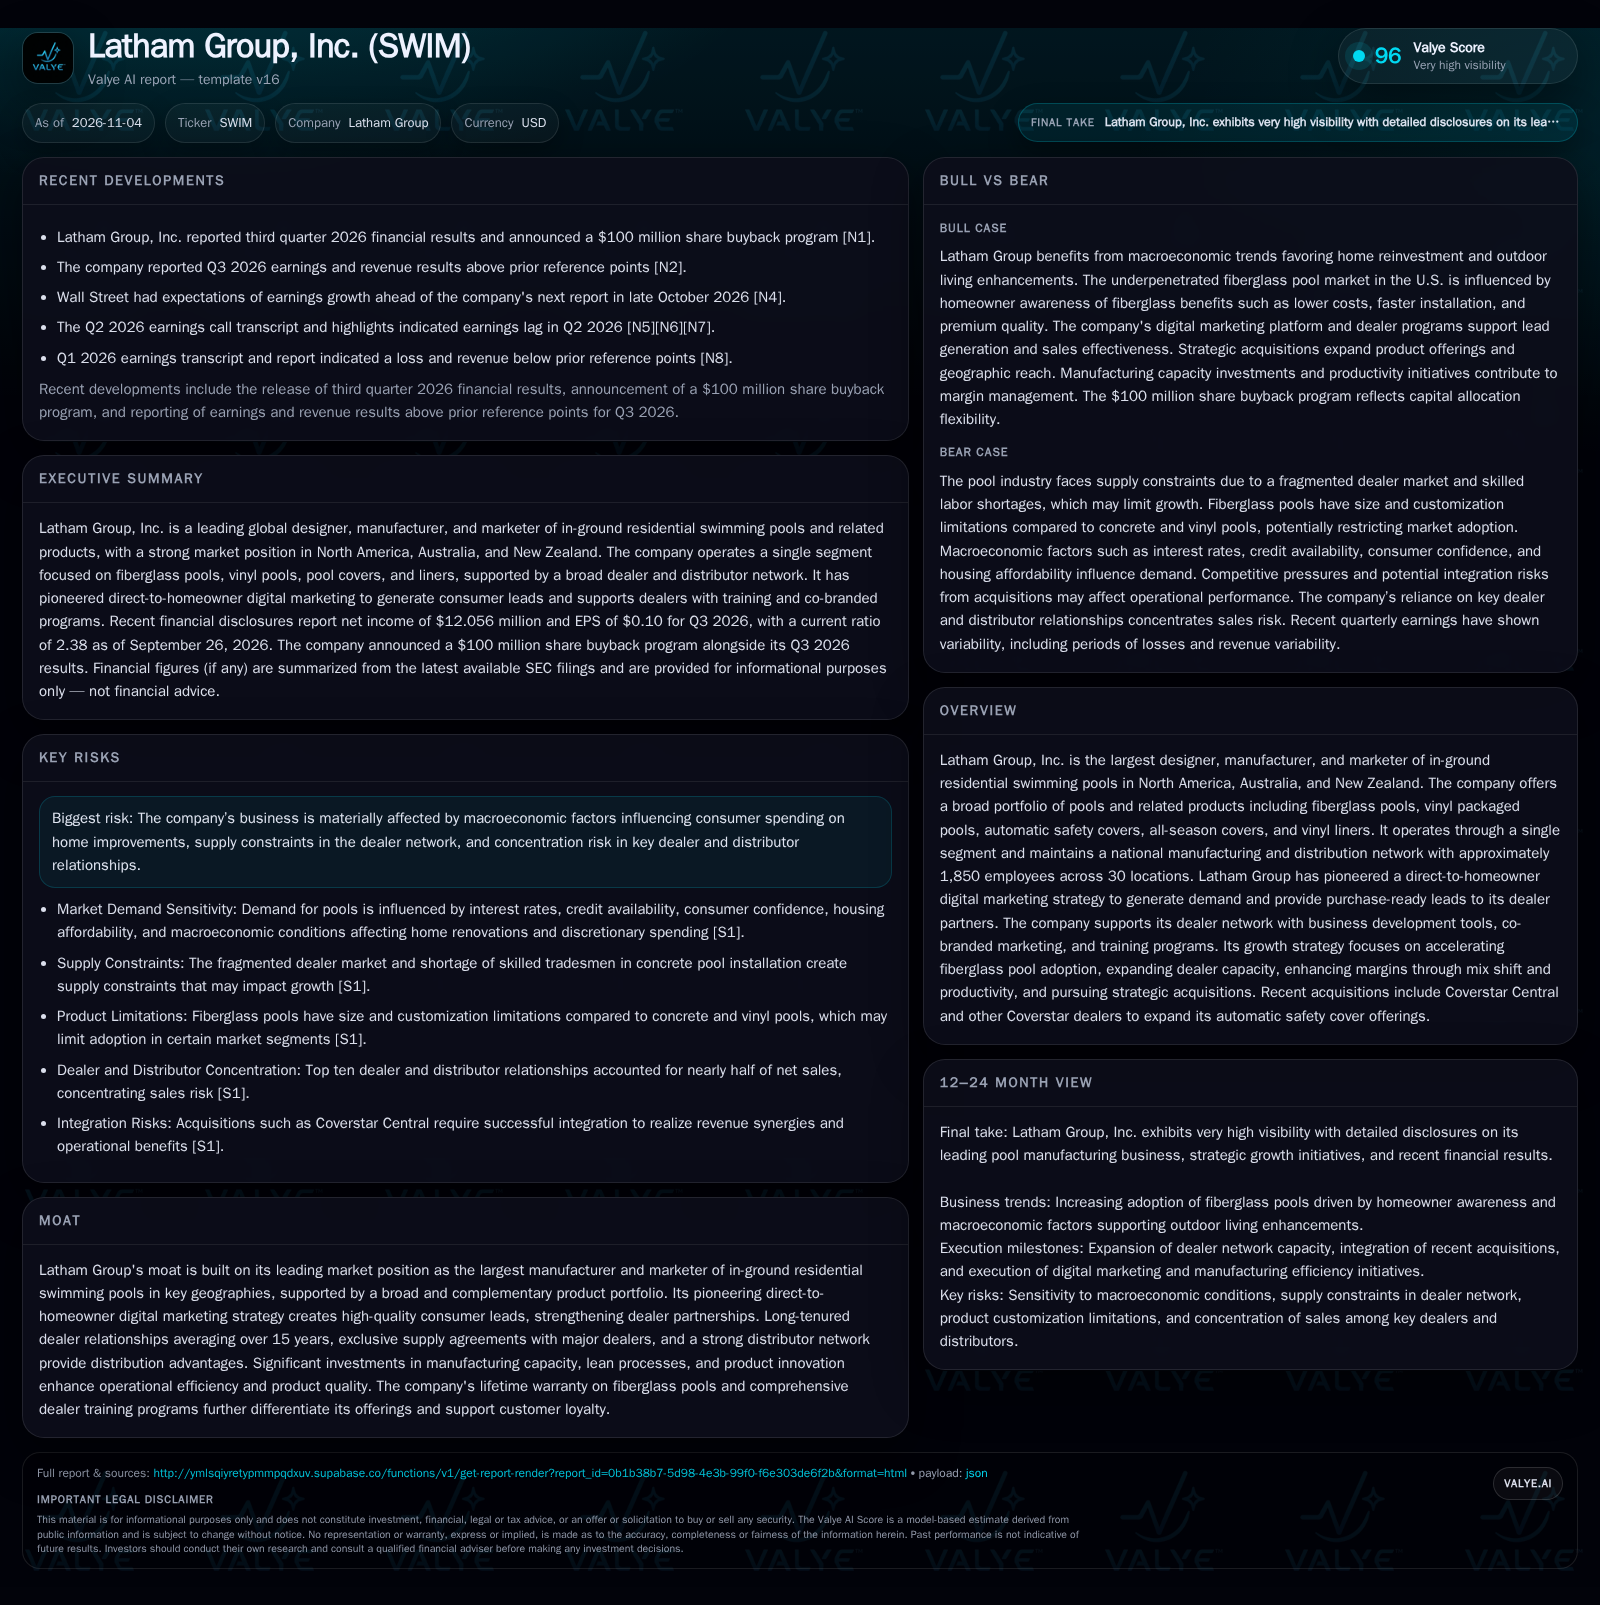
Latham Group posted Q3 2026 net income of $12.1M and EPS of $0.10, announced a $100M share buyback, and is pushing fiberglass pool adoption and dealer expansion. Its moat is built on scale, digital lead generation, and long-standing dealer ties, but the business is sensitive to macro demand, dealer network limitations, and revenue concentration. Acquisitions and operational initiatives may expand margin and reach, but execution and integration remain pivotal.
Latham Group, Inc. stands at a strategic crossroads: as the largest in-ground residential pool manufacturer in North America, it is well-positioned to benefit from trends in home reinvestment and outdoor living. The company’s recent $100 million buyback announcement and Q3 profitability underscore both financial discipline and management’s focus on shareholder value. Yet, Latham’s growth ambitions—anchored in accelerating fiberglass pool adoption and expanding dealer reach—are balanced against real-world challenges: a fragmented dealer network, macroeconomic sensitivity, and high sales concentration. The coming quarters will test whether its scale, digital marketing edge, and acquisition-driven expansion can overcome industry constraints and deliver sustainable, margin-accretive growth.
Recent Profitability, Capital Deployment, and Strategic Expansion
Latham Group reported net income of $12.056 million and EPS of $0.10 for Q3 2026, with a current ratio of 2.38 as of September 26, 2026 [S2] [N1]. These results mark a return to profitability following previous quarters of earnings volatility, reflecting the company’s ability to navigate seasonality and cyclical demand swings. In conjunction with these financials, Latham announced a $100 million share buyback program—a significant capital allocation move that suggests management’s confidence in the company’s valuation and future prospects [N1].
Strategically, Latham continues to invest in expanding its fiberglass pool portfolio and has executed acquisitions—including Coverstar Central and other Coverstar dealers—to bolster its automatic safety cover offerings. The company’s growth strategy remains anchored in driving fiberglass pool adoption, expanding dealer capacity, and leveraging its direct-to-homeowner digital marketing platform to generate qualified leads and support dealer sales effectiveness.
How Latham Makes Money: Product Mix, Dealer Economics, and Margin Levers
Latham’s core business economics are driven by the manufacture and sale of in-ground pools—primarily fiberglass and vinyl—along with related products such as covers and liners. Revenue is generated predominantly through a nationwide dealer and distributor network, with Latham supporting these partners via lead generation, training, and co-branded marketing. The company’s pioneering digital marketing strategy helps shift demand by reaching homeowners directly, but sales are ultimately fulfilled through the dealer channel.
Fiberglass pools, while offering faster installation and lower maintenance, typically carry higher gross margins than vinyl or concrete alternatives due to manufacturing efficiencies and premium positioning. A strategic mix shift toward fiberglass pools and automatic safety covers could enhance overall profitability, provided that dealer capacity and homeowner awareness continue to rise. However, the capital intensity of manufacturing and the need for ongoing investment in automation and process improvement mean that fixed costs are significant, and operating leverage is realized only when volumes are strong.
Cash flows are inherently seasonal—peaking in spring and summer—and sensitive to swings in consumer discretionary spending tied to macroeconomic and housing cycles. The company reported cash and liquidity metrics for the period; these figures do not by themselves establish operating runway, investment capacity, financial flexibility, or financing capacity.
Defensible Advantages and Competitive Vulnerabilities in the Pool Industry
Latham’s competitive position is underpinned by its scale—operating 30 locations with about 1,850 employees—and its status as the largest in-ground residential pool manufacturer in North America, Australia, and New Zealand. Its broad product portfolio, encompassing fiberglass, vinyl, covers, and liners, enables cross-selling and one-stop solutions for dealers. The company’s direct-to-homeowner digital marketing platform generates high-quality leads that are funneled to its dealer network, creating a virtuous cycle of demand generation and dealer loyalty.
Long-tenured dealer relationships (averaging over 15 years), exclusive supply agreements, and a reputation for product quality (including a lifetime warranty on fiberglass pools) further reinforce switching costs and customer stickiness. However, Latham faces competition from regional manufacturers, importers, and alternative pool technologies—particularly concrete pools, which offer greater customization. The fragmented dealer market and shortage of skilled labor in pool installation represent structural constraints that can limit volume growth, regardless of consumer demand.
Competitive threats also emerge from potential substitutes for backyard leisure spending and the risk that digital marketing leadership could be replicated by well-capitalized rivals. The company’s high concentration of sales among its top ten dealers exposes it to channel risk if any major partner defects or reduces order volume.
Accelerated Fiberglass Adoption and Dealer Expansion Drive Margin Upside
A favorable scenario for Latham would see a sustained macro tailwind—such as continued home improvement spending and low interest rates—fueling strong demand for in-ground pools. If the company’s digital marketing continues to generate high-quality homeowner leads and dealer partners are able to expand capacity (either organically or via recruitment and training programs), Latham could capture share from less organized competitors and alternative pool types.
Further, a successful mix shift toward higher-margin fiberglass pools and automatic safety covers, combined with manufacturing efficiency gains, could drive meaningful margin expansion. The integration of recent acquisitions—if managed well—may unlock cross-selling opportunities and strengthen regional coverage. Confirmation of this scenario would include consistent quarter-over-quarter revenue and margin growth, rising fiberglass pool penetration rates, and evidence of dealer network expansion without a corresponding rise in channel concentration.
Navigating Cyclical Demand Amid Dealer and Product Constraints
The most plausible trajectory for Latham is continued growth at a moderate pace, tempered by ongoing macroeconomic uncertainty and industry-specific bottlenecks. While the company’s scale and digital marketing platform should help it capture incremental demand, the fragmented dealer base and skilled labor shortages are likely to cap the speed of volume expansion. Product limitations of fiberglass pools—in terms of size and customization—will keep concrete and vinyl alternatives relevant in certain market segments.
Expectations would be for seasonal revenue and earnings swings, with periods of volatility tied to housing market trends, consumer confidence, and broader economic conditions. The company is likely to continue pursuing tuck-in acquisitions and investing in dealer enablement, but the top ten dealer concentration will remain a structural risk unless the network is further diversified. Base case evidence would include steady, if lumpy, revenue growth, stable gross margins, and periodic variability in earnings as macro and channel factors ebb and flow.
Dealer Network Constraints and Macroeconomic Shocks Expose Revenue Fragility
In a less favorable scenario, a sharp downturn in housing activity or consumer confidence—driven by higher interest rates, tighter credit, or a recession—would curtail discretionary spending on home improvements and pool installations. Latham’s exposure to these cycles is amplified by its reliance on a fragmented dealer network that may lack the financial resilience to weather prolonged slowdowns.
If dealer capacity is constrained or if key partners reduce orders, revenue could fall disproportionately given the company’s high channel concentration. Integration missteps with recent acquisitions or execution failures in digital marketing could compound these issues, resulting in margin compression, inventory build, and cash flow pressure. Downside evidence would include declining order volumes, rising dealer attrition or concentration, margin erosion, and possibly the suspension or reduction of share buybacks or capital investments.
Milestones and Metrics That Will Shape Latham Group’s Trajectory
Quarterly revenue growth and gross margin trends, which will indicate the effectiveness of mix shift and operational initiatives.
Dealer network expansion and diversification—if disclosed, tracking the share of sales attributable to the top ten dealers and progress in reducing channel concentration.
Adoption rates of fiberglass pools relative to vinyl and concrete, as a proxy for margin potential and competitive positioning.
Integration progress and revenue contribution from recent acquisitions, particularly in automatic safety covers.
Lead generation efficiency and conversion rates from digital marketing programs—if disclosed, these metrics would help validate the company’s demand creation strategy.
Capital allocation updates, including the pace and scale of share buybacks versus reinvestment in manufacturing and dealer support.
Macro indicators relevant to the pool industry: housing starts, interest rates, and consumer confidence, which will shape end-market demand.
Disclaimer: This is research-only, informational analysis and not investment advice. It may include AI-generated interpretation and general industry context. Always verify important details using primary sources.

Comments