
Truist Financial Expands Revenue Streams with Strong Q1 Loan and Deposit Growth
Truist delivered robust first quarter 2026 results marked by loan and deposit expansion, diversified fee income gains, and disciplined capital returns.
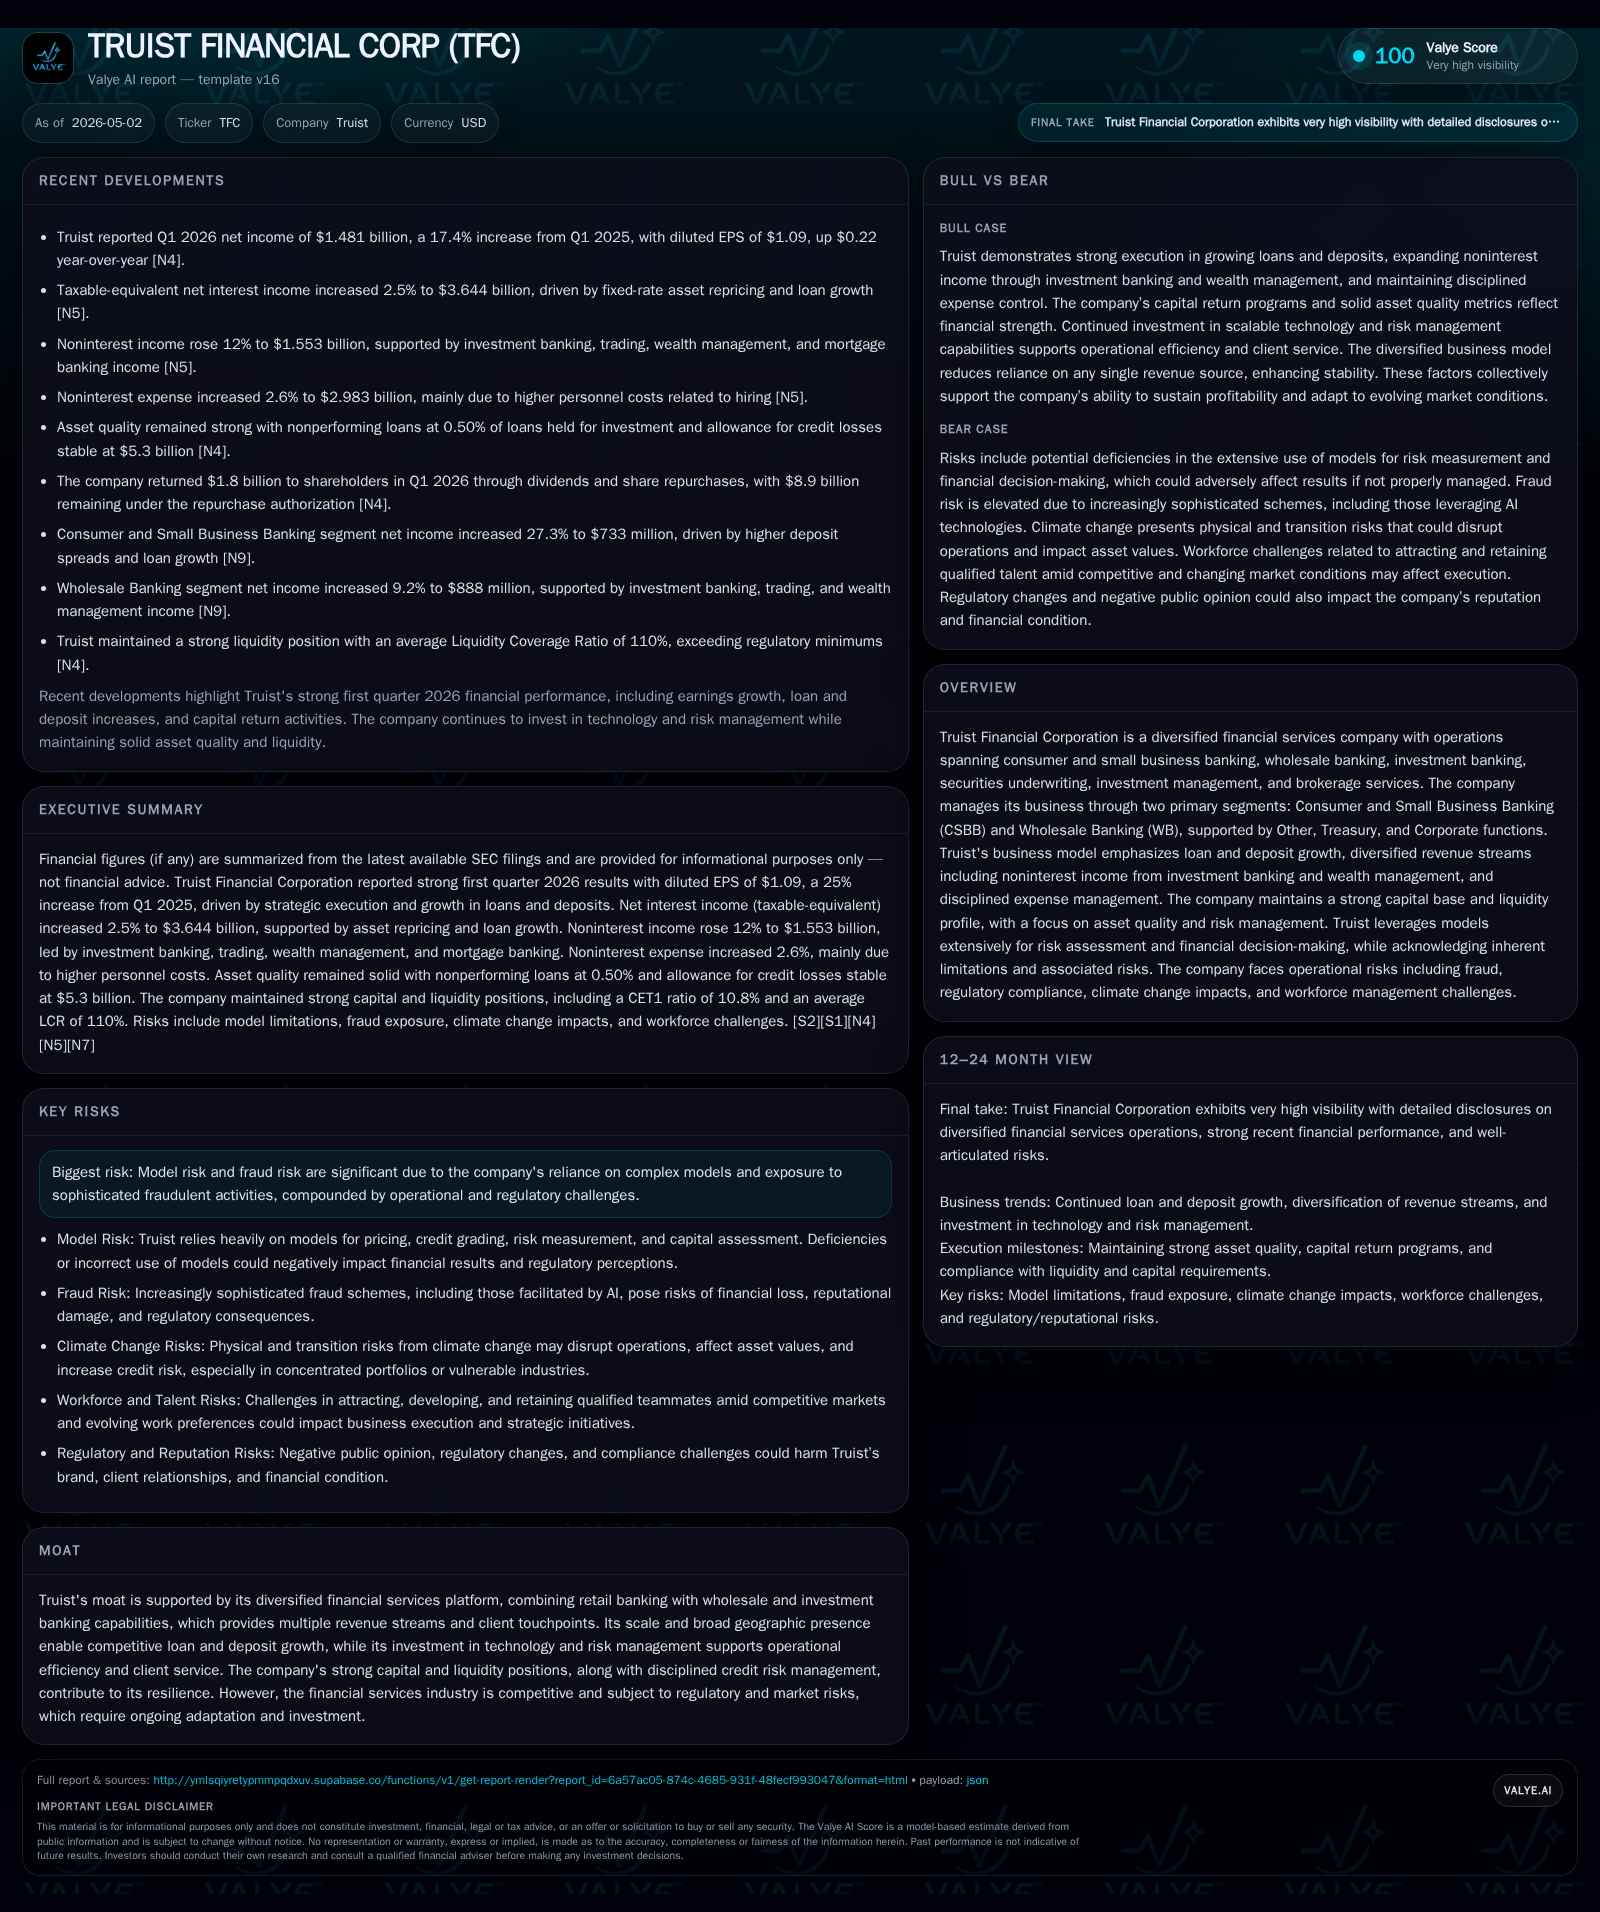
In Q1 2026, Truist Financial reinforced its diversified earnings base with a 2.5% rise in taxable-equivalent net interest income driven by loan and deposit growth. Noninterest income grew 12%, fueled by investment banking and wealth management segments, supporting a 25% increase in diluted EPS. The company maintained solid asset quality while returning $1.8 billion to shareholders through dividends and share repurchases. Truist's multi-segment platform coupled with scalable technology investments underpin its competitive positioning amid a complex regulatory and cybersecurity risk environment.
Q1 2026 Operating Results Highlight Growth and Efficiency Gains
Truist Financial reported strong first quarter results for 2026 on May 1st [S2], underscoring momentum from balanced growth initiatives across its business lines. Net interest income on a taxable-equivalent basis increased by $89 million or 2.5% year-over-year to $3.64 billion, driven primarily by $21.4 billion (7%) growth in average total loans and fixed-rate asset repricing despite some offset from liability repricing pressures. Average earning assets rose 2.1%, bolstered also by increases in consumer deposits in attractive markets.
Noninterest income rose $161 million or 12%, reflecting significant contributions from investment banking fees, trading profits, wealth management services, and mortgage banking activities. This diversification beyond traditional net interest revenue demonstrates Truist’s ability to capture fee-based streams that partially insulate results from interest rate variability.
Operating expenses increased modestly by $77 million or 2.6%, indicating disciplined cost control relative to revenue growth. The efficiency paired with top-line expansion translated into income before taxes rising $155 million to $1.69 billion.
Diluted earnings per share surged 25% year-over-year to $1.09 driven by higher profitability complemented by active capital return programs totaling $1.8 billion: $645 million in dividends plus $1.1 billion in share repurchases during the quarter [S6]. Truist ended Q1 with nearly $8.9 billion remaining under its ongoing $10 billion share repurchase authorization.
Asset quality metrics remain stable amid growth; the allowance for loan losses stayed steady at approximately 1.53% of loans outstanding, while provisions for credit losses marginally rose to $479 million from prior-year levels reflecting cautious underwriting amid macro uncertainties [S16]. Nonperforming assets showed no material deterioration.
Capital ratios remained robust with CET1 at a preliminary 10.8%, flat sequentially even after shareholder distributions due to earnings accretion [S26]. Liquidity levels are strong as evidenced by an average Liquidity Coverage Ratio of 110%, comfortably exceeding regulatory minima, supported by broad sources including client deposits, secured funding like FHLB advances, repo agreements, and substantial unencumbered securities positions valued near $89 billion [S7][S9].
Business Model Overview: Diversified Financial Services with Dual Segments
Truist operates principally through two synergistic operating segments: Consumer and Small Business Banking (CSBB), which delivers retail deposits, consumer loans, mortgages, credit cards, as well as small business lending; and Wholesale Banking (WB), encompassing commercial loans, investment banking advisory services, securities underwriting, brokerage services, institutional trading operations, and wealth management advice [S1].
This dual-segment configuration supports diversified revenue streams balancing stable net interest margins — predominantly generated through CSBB loan/deposit relationships — alongside fee-based revenues concentrated in WB from investment banking fees, trading commissions, underwriting spreads, and asset management fees.
Revenue mechanics emphasize capturing scale economies via cross-selling opportunities enabled by integrated client engagement across both segments; for example, providing corporate clients in WB access to deposit products or treasury management solutions sourced from CSBB capabilities and vice versa enhances wallet share while presenting switching-cost barriers.
Moreover, Truist has demonstrated significant technology investments to automate credit risk assessment models used extensively in underwriting consumer loans as well as commercial credits; this infrastructure not only improves decision speed but also manages risk-adjusted pricing precision thereby supporting asset quality consistency.
Competitive Positioning within Consumer, Small Business, and Wholesale Banking
Truist stands as a formidable competitor given its large-scale platform resulting from prior mergers among regional banks coupled with focused expansions into new geographic territories with favorable economic demographics. Its footprint grants access to diverse customer bases that bolster deposit gathering capability—critical amid industry-wide funding cost uncertainties—and enhance lending opportunities enabling sustained balance sheet growth.
The company's pricing power benefits from this scale advantage when competing for loans in commercial lending markets where relationship banking prevails alongside competitive deposit pricing geared toward retail consumers via improved digital experiences.
Technological sophistication is notable relative to many regional bank peers—Truist engages advanced analytics for market risk management combined with recent digital platform rollouts improving customer onboarding speed and mobile engagement—which enhances both client retention rates and operating leverage potential.
However, the industry remains highly competitive with pressures both from fintechs eroding some retail customer segments demanding innovative digital propositions as well as larger national banks dominating certain wholesale product verticals imposing margin compression risks.
Regulatory compliance complexity is another vector shaping competitive dynamics particularly impacting the wholesale division where transaction volumes and syndicated lending demand stringent controls amidst evolving supervisory scrutiny [S1].
Key Growth Drivers Behind Revenue Expansion and Market Penetration
Loan portfolio growth remains paramount—with Q1 showing strength via increases across commercial & industrial portfolios (+7%), commercial real estate (+22%), residential mortgages (+1.4%), auto financing (+9%) reflecting effective market penetration strategies targeting borrowers in economically attractive regions displaying solid credit fundamentals [S16].
Fee-based revenue acceleration stems largely from expanded investment banking advisory mandates evidenced by upticks in underwriting activity coinciding with revived equity issuance markets; complemented by wealth management assets under administration growing due to both market appreciation and net inflows linked to enhanced advisory platforms [N11].
Continued deployment of scalable technology investments aimed at streamlining operations fuel medium-term margin improvement prospects—automation of back-office processes reduces noninterest expense growth sensitivity while enhancing client-facing capabilities sustains retention and attracts new relationships.
Cross-selling effectiveness continues improving due to integrated client relationship managers coordinating tailored solutions spanning deposits/loans/trading accounts tailored per customer verticals increasing wallet-share per client.
Capital deployment initiatives underscore willingness to monetize excess capital through sizable ongoing stock repurchases funded by robust earnings generation strengthening shareholder returns visibility while maintaining capital ratios above regulatory minima ensuring growth optionality remains intact [S6][S26].
Risks and Constraints Including Model, Fraud, and Cybersecurity Considerations
A pronounced vulnerability lies in Truist’s substantial reliance on sophisticated risk models which underpin credit decisioning as well as capital adequacy estimations; despite rigorous validation efforts inherent limitations expose the firm to model risk stemming from mis-specification or inadequate data inputs especially under stressed economic scenarios potentially leading to mispriced credit exposures or underestimated reserves [S1].
Fraud risk amplifies amid the evolving threat landscape intensified by scaling digital channels where fraudsters exploit complex techniques including AI-generated synthetic identities requiring continued advancements in detection algorithms coupled with human oversight.
Cybersecurity represents a continuous high-priority threat vector; Truist employs a comprehensive Corporate Information Security Program aligned with financial sector frameworks (e.g., NIST) leveraging simulations/exercises involving Cyber Fusion Centers designed for rapid incident response but acknowledges adversaries’ growing sophistication including emerging machine learning enabled attacks necessitating perpetual capabilities enhancement [S1].
Operational risks related to potential divestitures or restructuring exercises could induce transitional costs or distract leadership focus adversely impacting results if not executed smoothly particularly since these involve complex regulatory approvals and integration challenges influencing strategic agility [S1].
Upcoming Operational Milestones and Capital Allocation Strategies
Monitoring loan growth rates across specific product categories relative to industry cycles will be key near-term demand markers alongside further noninterest income contributions particularly within investment banking transaction pipelines expected from recent deal wins announced post-quarter.[S3]
Management commentary on next quarterly guidance updates will elucidate prospects around expense trajectory amid inflationary pressures balanced against productivity gains from automation initiatives.[S2]
Capital allocation policy prioritizes continued shareholder-friendly posture—$8.9 billion share repurchase capacity remaining signals sustained buyback activity ahead dependent on market conditions alongside steady common dividend policy targeting payout ratio near mid-40%s while preserving adequate buffers above internal stress thresholds.[S6]
Digital platform rollouts scheduled throughout mid-2026 intended to further enhance omni-channel delivery remain critical execution points influencing future client acquisition rates alongside competitive differentiation.[N11]
Regulatory developments related particularly to wholesale banking supervision will require ongoing surveillance given potential impact on capital requirements or permissible activities influencing profitability dynamics.
Supplemental Financial Summary from Latest Quarterly Report
The quarter exhibited steady net interest margin at approximately 3.02% (taxable-equivalent), marginally up one basis point year-over-year despite mix shifts favoring lower-yielding yet higher quality loans demonstrating prudent asset allocation.[S2]
Return on average common shareholders’ equity improved meaningfully by 120 basis points to 9.3%, reflecting enhanced profitability through combined revenue expansion coupled with expense discipline.[S2]
Effective tax rate declined contributing favorably to net income advancement attaining $1.48 billion overall representing a 19% increase over prior year period.[S2]
Total revenue increased over prior year quarters driven equally by net interest income gains plus robust noninterest revenue affirming diversification strategy effectiveness.[S2]
Liquidity metrics remained solid sustaining access to favorable funding sources while balancing wholesale borrowings with robust deposit base lowering dependence on more volatile funds.[S7][F1]
Disclaimer: This analysis is provided solely for informational purposes without any form of investment advice or recommendation regarding any securities mentioned herein.
Disclaimer: This is research-only, informational analysis and not investment advice. It may include AI-generated interpretation and general industry context. Always verify important details using primary sources.
Comments