
Union Bankshares: Margin Expansion, Asset Growth, and the Strategic Stakes of Regional Scale
Union Bankshares is demonstrating incremental margin improvement and modest growth in loans and deposits, but faces rising operational expenses and a slight uptick in nonperforming assets. The challenge ahead is to sustain profitability and capital strength as competition and rate uncertainty intensify.
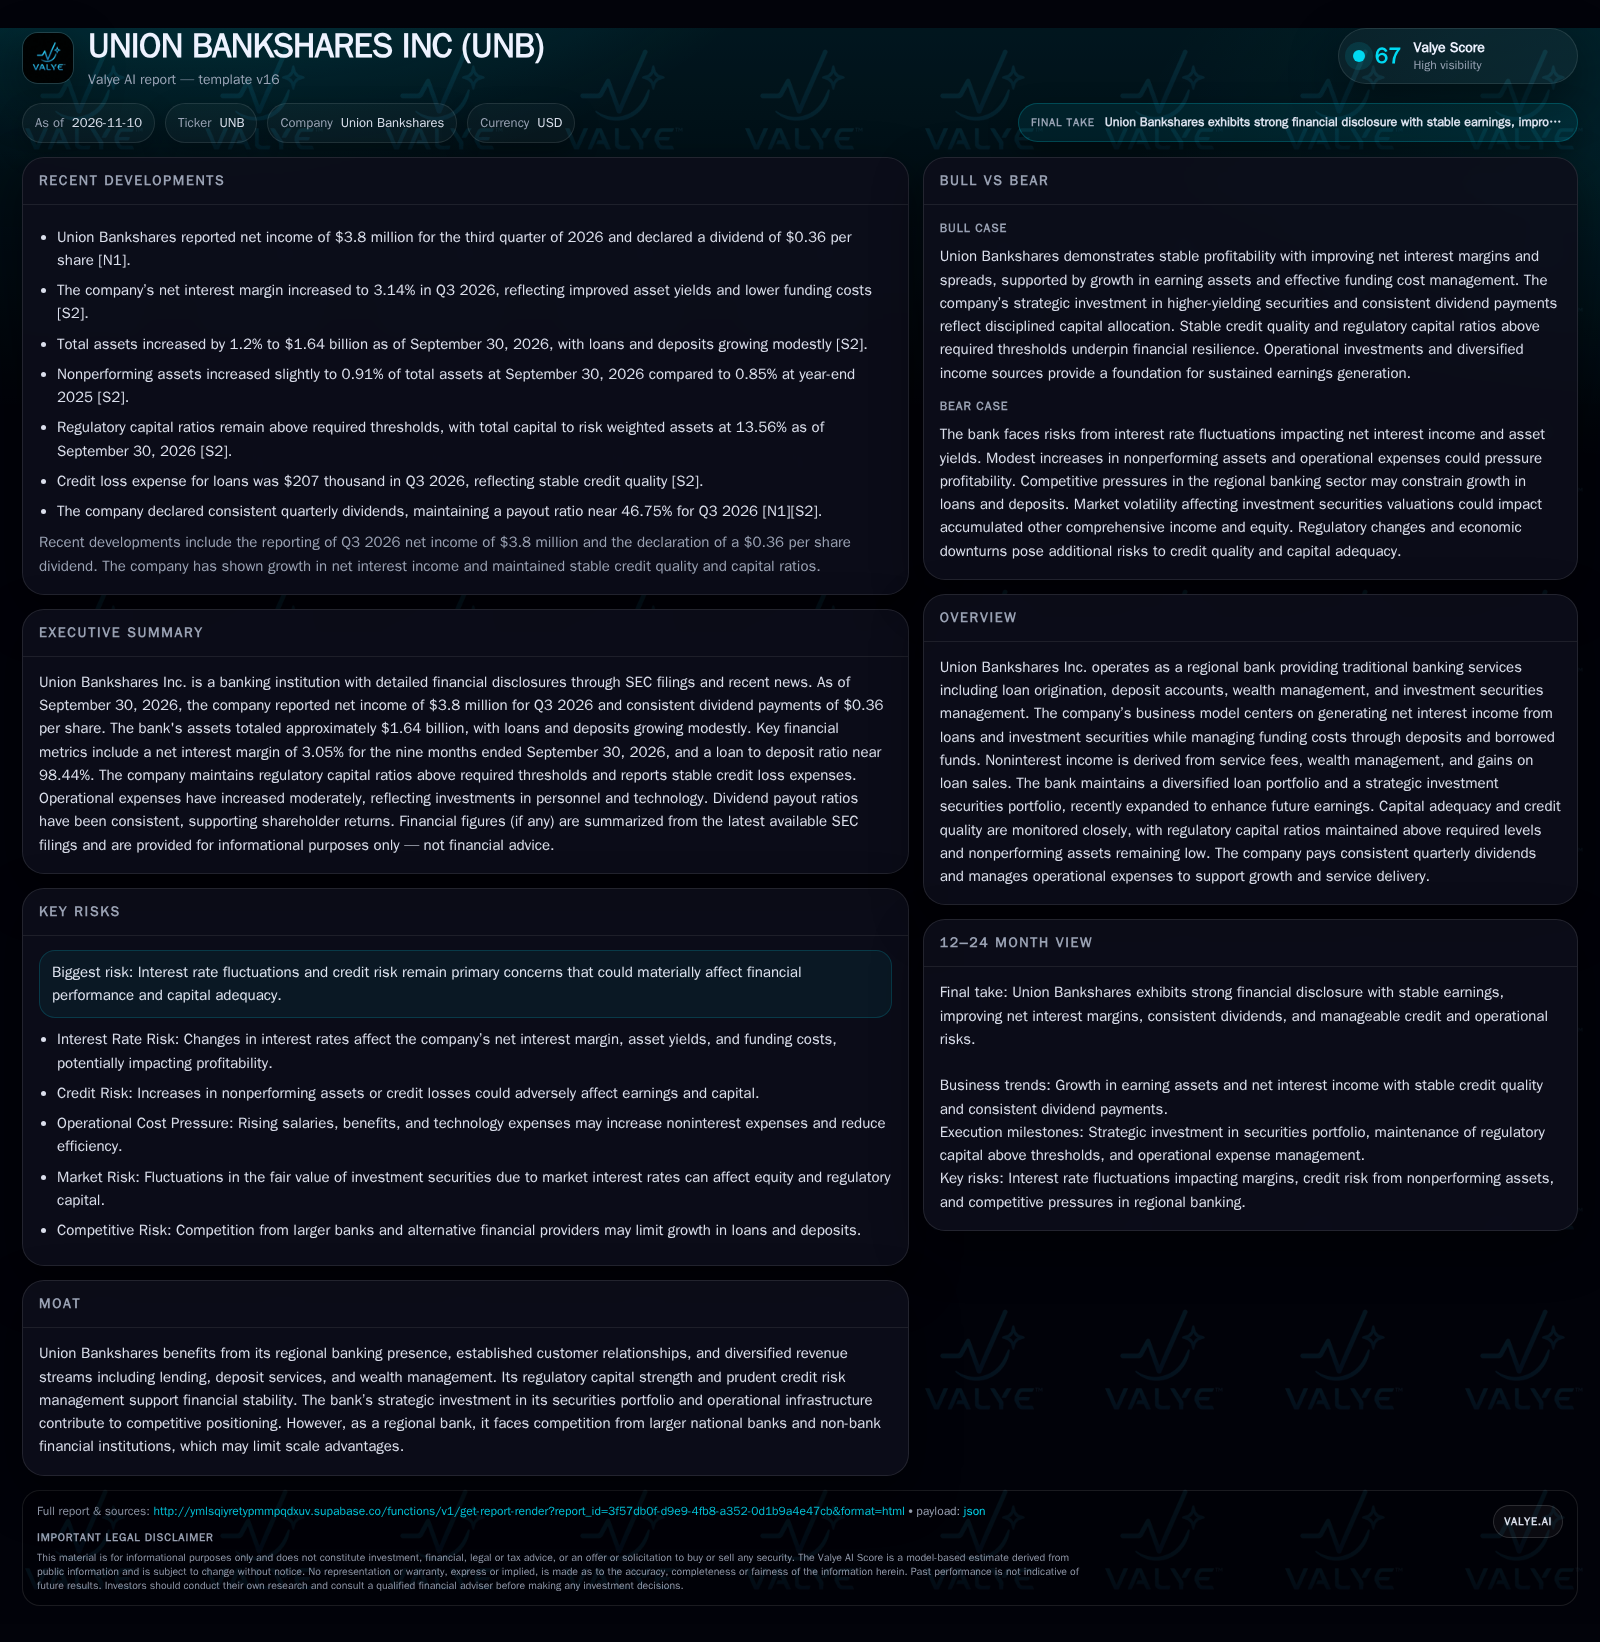
Union Bankshares reported Q3 2026 net income of $3.8 million, a net interest margin of 3.14%, and continued asset growth to $1.64 billion. While credit quality remains solid and capital ratios are above required thresholds, operational costs are rising and nonperforming assets have edged up. The bank's ability to manage funding costs, preserve credit quality, and scale noninterest income will likely shape its resilience and growth prospects over the next year. [N1] [S2]
Union Bankshares enters late 2026 with a profile of cautious growth: net interest margin is expanding, assets and deposits are rising, and credit quality remains broadly stable. The bank’s disciplined capital and dividend strategy is intact, but management faces creeping operational costs and a modest increase in nonperforming assets. In a regional banking environment where scale and funding costs can quickly shift competitive dynamics, Union Bankshares’ ability to maintain profitability and regulatory strength will be tested by both external rate moves and internal execution.
Recent Margin Gains and Asset Growth Define the Current Landscape
Union Bankshares reported net income of $3.8 million for the third quarter of 2026, underscoring a continuation of stable profitability. The net interest margin increased to 3.14% in Q3 2026 from 3.05% for the year-to-date period, reflecting an improved spread between asset yields and funding costs—a crucial lever for regional banks operating in a competitive rate environment. Total assets edged up 1.2% to $1.64 billion as of September 30, 2026, with both loans and deposits showing modest growth. Nonperforming assets rose slightly to 0.91% of total assets, compared to 0.85% at year-end 2025, and regulatory capital ratios remain comfortably above required thresholds, with total capital to risk-weighted assets at 13.56% [N1] [S2]. These facts together reveal a bank maintaining moderate growth and credit discipline, while operational expenses are cited as increasing moderately on personnel and technology investments.
How Union Bankshares Earns: Net Interest Income, Funding Dynamics, and Expense Leverage
Union Bankshares’ core economic engine is the spread between interest earned on loans and securities and the cost of funding those assets through deposits and borrowings. The improvement in net interest margin to 3.14% suggests recent success in asset repricing and/or funding cost management, possibly due to a favorable deposit mix or disciplined loan pricing [S2]. The loan-to-deposit ratio near 98.44% indicates a high deployment of deposits into earning assets, maximizing interest income but potentially constraining future loan growth if deposit inflows slow. Noninterest income from service fees, wealth management, and gains on loan sales provides some diversification, though these streams are typically modest for regional banks.
Fixed costs—such as personnel and technology—are rising, which could challenge operating leverage if revenue growth does not keep pace. The incremental investments in technology may be necessary to maintain competitiveness against larger or more tech-enabled peers, but the payoff in efficiency or revenue-generation remains to be seen. Capital adequacy is maintained above regulatory minimums, allowing the bank to absorb potential credit shocks and support moderate balance sheet growth. Dividend payouts remain consistent, with a payout ratio near 47%, signaling a commitment to shareholder returns but limiting retained earnings for aggressive expansion.
Regional Scale, Relationship Banking, and the Threat from Larger and Digital Rivals
Union Bankshares’ competitive footing rests on its regional banking presence, long-tenured customer relationships, and a diversified mix of lending, deposit, and wealth management services. This relationship-driven model can foster sticky deposits and recurring business, but lacks the scale, technological reach, and product breadth of national banks or digital-first competitors. Larger banks may benefit from lower funding costs, broader product suites, and greater ability to absorb regulatory and technology investments. Meanwhile, fintechs and non-bank lenders are increasingly targeting core lending and payment activities, potentially eroding fee income and compressing margins for traditional players.
The bank’s strategic expansion of its investment securities portfolio is an attempt to bolster earnings, but exposes it to market risk and interest-rate-driven valuation swings. Its capital strength and credit discipline provide a buffer against shocks, yet the modest rise in nonperforming assets hints at latent credit risk that could become more pronounced in a deteriorating economic environment. The challenge is to leverage its regional roots and customer trust while adapting to the efficiency and service expectations set by larger and more agile competitors.
Earnings Upside If Margin Expansion Outpaces Cost Growth and Credit Remains Benign
If Union Bankshares can continue to expand its net interest margin—either through disciplined loan pricing, a stable or improving deposit mix, or further yield gains in the securities portfolio—while keeping credit costs low, the bank could deliver outsized earnings growth relative to its asset base. The company reported profitability for the period.
Confirmation of this scenario would include: sustained or rising net interest margin above 3.1%, stable or declining nonperforming asset ratios, manageable credit loss expenses, and evidence that operational investments are translating to improved efficiency ratios or new fee income streams. Falsification would occur if margin gains reverse due to competitive loan pricing or rising funding costs, or if operational expenses outstrip revenue growth.
Incremental Growth with Margin Stability and Controlled Credit Risk
The most plausible trajectory for Union Bankshares is steady but modest asset and earnings growth, with net interest margin stabilizing in the low-3% range and credit quality remaining within historical norms. Operational expenses may continue to rise moderately, but should be offset by incremental growth in loan and deposit balances and some contribution from noninterest income.
Confirmation would come from quarter-to-quarter stability in net interest margin, loan growth roughly tracking deposit inflows, credit loss expense remaining low, and operational expenses rising in line with revenue. A deviation from this path—such as a sharp rise in nonperforming assets, margin compression, or accelerating expense growth—would challenge the base case.
Profitability at Risk If Credit Deteriorates or Funding Costs Spike
An adverse scenario would unfold if nonperforming assets continue to rise, leading to higher credit loss expenses and potential capital erosion. A scenario where deposit growth slows or funding costs rise faster than asset yields would compress net interest margin, undermining the primary earnings engine. Operational expenses—particularly if technology investments fail to yield efficiencies—could further pressure profitability.
A sharp increase in the nonperforming asset ratio beyond 1%, rising loan loss provisions, or a drop in net interest margin below 3% would point toward downside realization. Additional warning signs would include a slowdown in deposit inflows, loss of key customer relationships, or regulatory capital ratios approaching minimums due to credit or market shocks.
Milestones and Metrics That Will Shape Union Bankshares’ 2027 Outlook
Quarterly net interest margin trends—evidence of further expansion, stability, or renewed compression.
Growth rates in loans and deposits, with particular attention to the loan-to-deposit ratio and the ability to fund asset growth internally.
Nonperforming asset ratio movement—whether the recent uptick is a blip or the start of a broader credit deterioration.
Credit loss expense and loan loss provision trends as a signal of underlying asset quality.
Operational expense growth relative to revenue, and whether technology investments are driving improved efficiency ratios (if disclosed).
Changes in the composition and fair value of the investment securities portfolio, given market rate volatility.
Regulatory capital ratios, particularly total capital to risk-weighted assets, as a buffer against credit or market shocks.
Disclaimer: This is research-only, informational analysis and not investment advice. It may include AI-generated interpretation and general industry context. Always verify important details using primary sources.

Comments