
Waste Management in 2026: Automation, Acquisitions, and the Dynamics of Margin Resilience
Waste Management Inc’s 2026 results highlight a business balancing robust revenue growth from acquisitions and operational gains against persistent pressures from commodity volatility, integration complexity, and working capital constraints. The company’s push into automation and digitalization is central to its margin strategy, but competitive and macroeconomic headwinds remain significant variables.
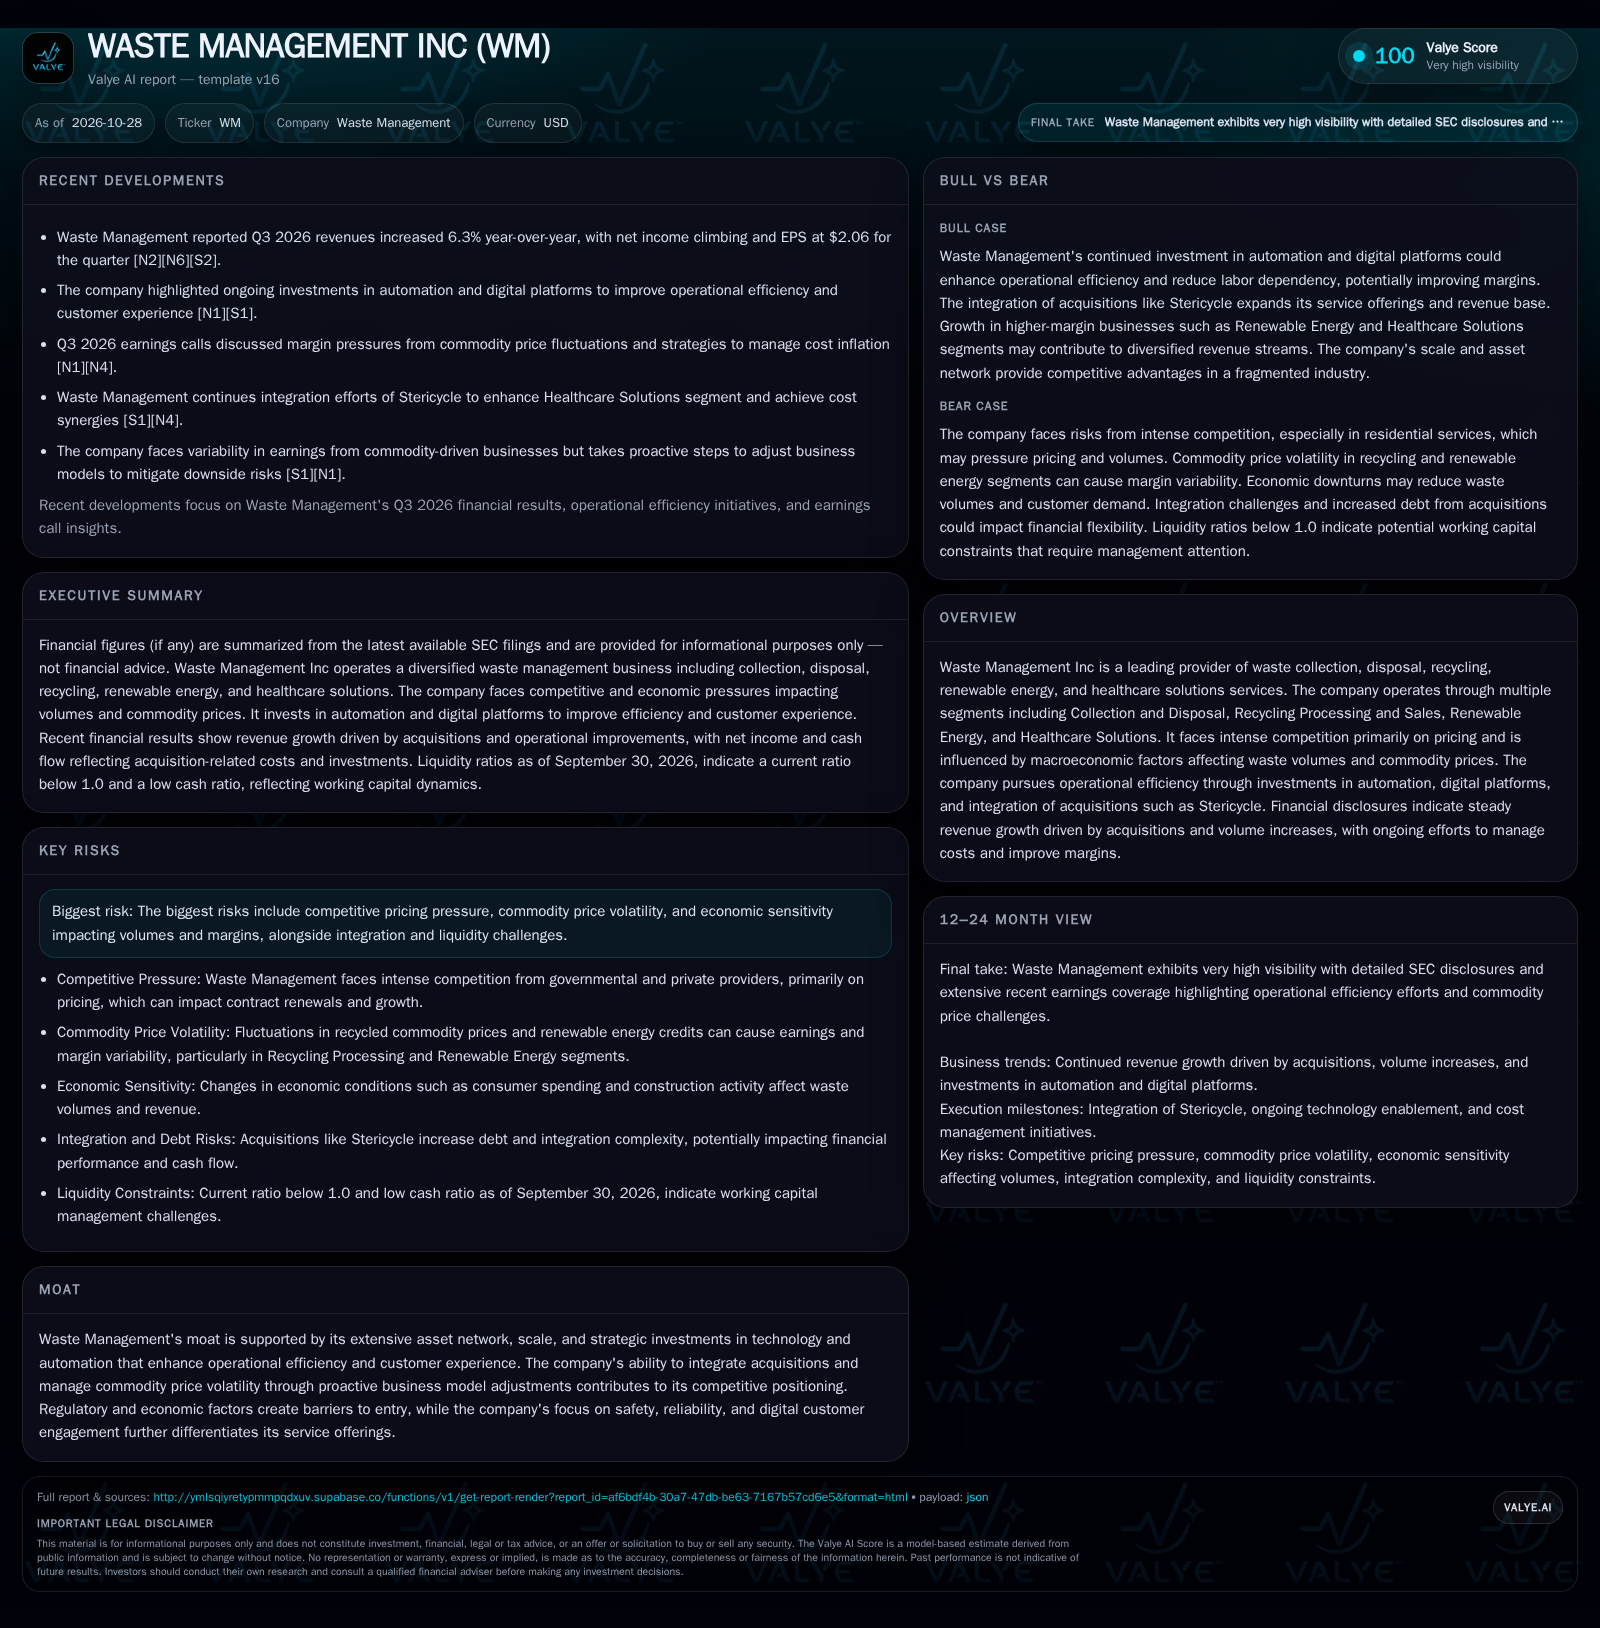
Waste Management grew revenues 14.2% in 2025 and 6.3% year-over-year in Q3 2026, supported by acquisitions and efficiency investments, but faces margin pressures from commodity swings, integration costs, and a sub-1.0 current ratio. The company’s thesis now hinges on its ability to leverage automation and scale to offset volatility in recycling and renewable energy, while integrating new businesses and managing liquidity tightly. [S1] [S2] [N2] [N4] [N6]
Waste Management Inc enters late 2026 as a scale-driven, diversified operator in waste, recycling, renewable energy, and healthcare solutions, reporting headline revenue gains but facing familiar margin and capital allocation challenges. The company’s recent growth is largely acquisition-fueled and supported by operational efficiencies from automation and digital investments. Yet, this progress is counterbalanced by the drag from commodity price swings, integration complexity, and a working capital profile that demands careful navigation. The next phase for Waste Management hinges on its ability to translate scale and technology investments into sustainable margin gains while proving that recent acquisitions can deliver not just revenue but also durable profitability.
2026 Financial Results: Growth, Margin Dynamics, and Operational Priorities
Waste Management reported 2025 full-year revenues of $25.2 billion, marking a 14.2% increase over 2024, with the latest Q3 2026 quarter showing a 6.3% year-over-year revenue gain. These gains are attributed to the integration of acquisitions, notably Stericycle, as well as volume increases in landfill, recycling, and renewable energy segments. Operating expenses rose in absolute terms due to these acquisitions and new renewable natural gas facilities, but as a percentage of revenue, costs declined, reflecting efficiency gains and pricing actions. Net income for 2025 was $2.7 billion, marginally down year-over-year, with higher interest expense from acquisition-related debt as the principal offset. Free cash flow improved to $2.9 billion in 2025, supported by both higher operating cash flow and lower capital investment in sustainability projects. The company reported cash and liquidity metrics for the period; these figures do not by themselves establish operating runway, investment capacity, financial flexibility, or financing capacity. [S1] [S2] [N2] [N4] [N6]
How Scale, Pricing, and Commodity Exposure Drive Waste Management’s Profit Model
At its core, Waste Management’s economic engine depends on the interplay of contracted collection/disposal (relatively stable), commodity-exposed recycling and renewable energy, and increasingly, specialized healthcare waste solutions. The company’s scale allows for route density, which can drive operating leverage if volumes rise or if automation reduces labor input per stop—a key source of margin expansion. Pricing power is most evident in commercial and industrial contracts, where multi-year agreements and regulatory barriers can partially insulate against price wars, but residential business remains intensely price-competitive.
Variable costs dominate recycling and renewable energy, where margins swing with commodity prices for recyclables and renewable identification numbers (RINs). In contrast, fixed-cost leverage is present in landfill and collection, with automation and asset utilization improvements offering incremental gains. Recent capital allocation has favored technology and digital platforms, which could reduce labor intensity and improve customer retention, but these investments must deliver cost savings or incremental revenue to offset the margin variability in commodity-linked segments. Acquisitions like Stericycle bring both revenue growth and integration costs, with debt-funded deals raising interest expense and putting pressure on cash conversion and capital efficiency. [S1]
Competitive Pressures and the Limits of Scale Advantage
Waste Management’s competitive moat is anchored in its national network of collection, transfer, and landfill assets, which creates local density advantages and logistical efficiencies that smaller regional players struggle to match. However, this advantage is not absolute: governmental and quasi-governmental entities, as well as large private rivals, compete fiercely on price, particularly in residential markets where switching costs are low and contract renewals are frequent. In commercial and industrial verticals, regulatory complexity and infrastructure requirements create moderate barriers to entry, but price-based competition remains a constant.
The company’s push into healthcare solutions and renewable energy is partly a response to these pressures, seeking differentiated, higher-margin service lines. However, commodity exposure in recycling and renewable energy means that even scale does not fully shield margins from price volatility. Investments in automation and digitalization may enhance customer stickiness and reduce cost structures, but the question remains whether these initiatives can sustainably outpace the margin drag from volatile segments and integration friction. [S1]
Automation and Integration Deliver Sustained Margin Expansion
The bull case for Waste Management rests on a successful execution of its technology and operational strategy: automation reduces labor dependency, digital platforms improve customer experience and retention, and the integration of Stericycle unlocks both cost and revenue synergies. If these initiatives are realized, fixed-cost leverage from route density and network scale could drive margin expansion even if commodity prices remain volatile.
Confirmation would come in the form of sustained declines in operating expenses as a percentage of revenue, stable or rising margins in recycling and renewable energy despite commodity headwinds, and evidence that healthcare and renewable energy are contributing growing shares of profit. Falsification would result from persistent margin compression, integration delays, or customer churn in new segments. [S1] [N1] [N4]
Scale Supports Revenue Growth, But Margin Volatility Persists
The most plausible near-term outcome is continued headline revenue growth driven by acquisitions, modest organic volume increases, and incremental pricing gains in commercial and industrial segments. However, margin variability will likely persist as commodity-driven businesses remain exposed to external price swings, and integration costs from recent acquisitions continue to weigh on net income. Operating expense ratios may gradually improve as automation investments mature, but improvements could be offset by cyclical downturns or rising competition, especially in residential markets.
Evidence supporting this scenario would include steady but not dramatic improvement in free cash flow and operating margins, with periodic fluctuations in recycling and renewable energy profitability.
Commodity Swings, Integration Friction, and Liquidity Stress Erode Value
A bear-case trajectory would see commodity prices for recycled materials and renewable credits weaken further, amplifying earnings and margin variability in those segments. Competitive pressures—especially if rivals engage in aggressive price-cutting or municipalities in-source services—could erode volumes and pricing in both residential and commercial lines.
Confirmation of this scenario would be visible in sustained margin compression, rising operating expenses as a percentage of revenue, net income declines, or a further deterioration in working capital ratios. Signs of customer loss, contract churn, or inability to pass through cost inflation would also indicate that strategic investments are not delivering the intended resilience. [S1] [N1]
Milestones and Metrics That Will Test Waste Management’s Margin and Growth Thesis
Quarterly trends in operating expenses as a percentage of revenue—confirmation of automation and efficiency gains would show in a sustained downward trajectory, especially in labor-intensive segments.
Reported segment margin trends in Recycling Processing and Sales and Renewable Energy—stability or improvement would indicate effective commodity risk management.
Integration progress and synergy realization from the Stericycle acquisition—updates on cost savings or revenue synergies, if disclosed, would help test acquisition value-add.
Free cash flow conversion rates and capex discipline—continued improvement or stability would suggest efficient capital allocation and operational execution.
Working capital metrics, especially current and cash ratios—further deterioration could signal liquidity stress, while improvement would indicate better cash management.
Organic volume growth in landfill, commercial, and healthcare waste—sustained increases would support the case for underlying demand resilience.
If disclosed, customer retention rates and average contract duration in digitalized segments—would help assess whether investments in customer experience are yielding defensible relationships.
Pricing yield trends across business lines—ability to maintain or improve pricing in a competitive landscape would reinforce the scale and operational advantage thesis.
Disclaimer: This is research-only, informational analysis and not investment advice. It may include AI-generated interpretation and general industry context. Always verify important details using primary sources.

Comments