
CleanCore Solutions: Scaling Chemical-Free Cleaning Amid Profitability Hurdles and Contract Wins
CleanCore Solutions, Inc. is pursuing growth through proprietary chemical-free cleaning technology and significant multi-facility contracts, but its steep net losses and the economics of scaling remain central concerns. While reported liquidity position, the company’s ability to convert market acceptance into sustainable profitability is the critical question.
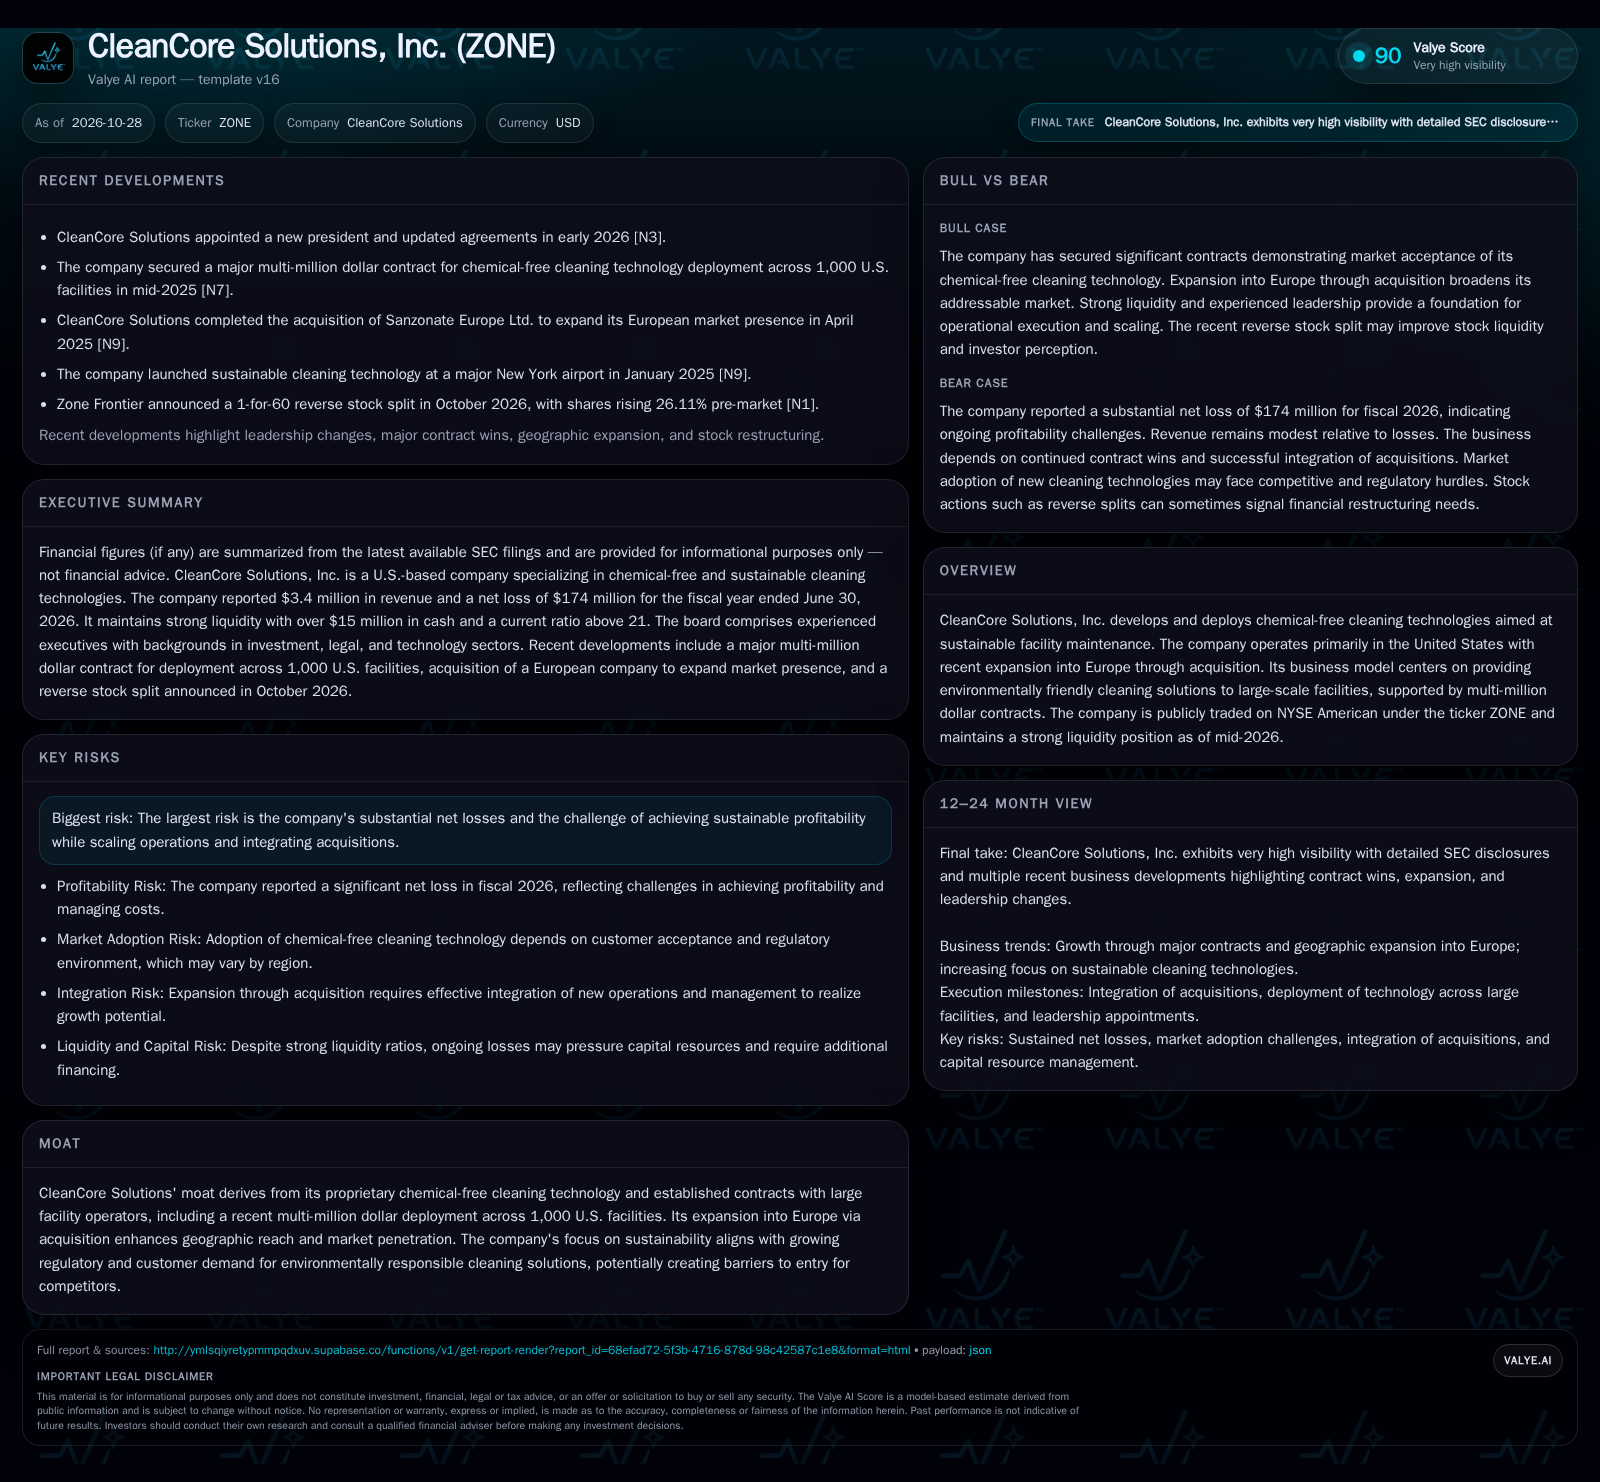
CleanCore Solutions is expanding via large contracts and a focus on sustainable, chemical-free cleaning technologies. The recent reverse stock split and leadership changes signal ongoing strategic shifts, with future success dependent on execution, market adoption, and cost control. [S1] [N1] [N3] [N7]
CleanCore Solutions, Inc. is positioning itself as a leader in the chemical-free cleaning technology space, targeting large-scale facility operators with sustainability mandates. Recent multi-million dollar contract wins and a reported liquidity position provide a foundation for future growth initiatives. However, a sharp net loss of $174 million in fiscal 2026 underscores significant operational and scaling challenges. The core issue for CleanCore is whether it can leverage its technological and commercial wins into a consistently profitable, defensible business.
Recent Contract Wins and Financial Realities Define the Present
CleanCore Solutions reported revenue of $3.4 million and a net loss of $174 million for the fiscal year ended June 30, 2026. The company’s cash and cash equivalents totaled $15.4 million, with a current ratio of 21.24 and a cash ratio of 17.52 as of that date. These metrics point to reported liquidity position, but also to a major profitability challenge given the scale of losses relative to revenue. A major commercial milestone was the securing of a multi-million dollar contract to deploy chemical-free cleaning technology across 1,000 U.S. facilities, a development that supports the company’s claims of market acceptance and provides a reference customer base for further expansion. Leadership changes—including the appointment of CEO Tyler Hassen and a new president in early 2026—signal a potential shift in execution strategy. The October 2026 1-for-60 reverse stock split, which saw shares rise 26% pre-market, reflects both ongoing capital market dynamics and a possible effort to improve the stock’s trading profile. [S1] [N1] [N3] [N7]
Sustainable Cleaning: Revenue Levers and the Cost Structure Challenge
CleanCore’s core business model centers on providing chemical-free cleaning solutions—likely a mix of proprietary hardware and consumables, with the potential for recurring service or maintenance revenue if commercialized as a platform. The economics of such a model can be attractive if contracts are structured with recurring components, especially with large facility operators who value sustainability and regulatory compliance. However, the company’s steep net losses relative to revenue suggest high fixed costs, possibly driven by R&D, manufacturing scale-up, or sales and marketing to secure major contracts.
With $3.4 million in revenue against $174 million in losses, CleanCore’s cost base appears front-loaded for growth or reflects significant upfront investment in technology and market development. If the company’s contracts are multi-year and include recurring elements—a detail not confirmed in the supplied evidence—operating leverage could improve as deployments scale. However, if revenues remain lumpy and tied to large one-off contracts, margin improvement may lag. The company reported cash and liquidity metrics for the period; these figures do not by themselves establish operating runway, investment capacity, financial flexibility, or financing capacity. [S1]
A critical factor influencing CleanCore's path to profitability is the scalability of its manufacturing and deployment processes. If the company can achieve economies of scale in production—reducing per-unit costs of hardware and consumables as volumes increase—it would materially improve gross margins. Conversely, if proprietary components require specialized materials or complex assembly, fixed costs may remain high, limiting margin expansion. Additionally, the sales cycle length and contract negotiation complexity with large facility operators could impact the timing and predictability of revenue streams. A longer sales cycle increases working capital needs and delays cash flow breakeven, emphasizing the importance of efficient customer onboarding and contract structuring.
Another dimension is the potential for CleanCore to build a recurring revenue model through service contracts, consumable replenishment, or performance-based pricing. If contracts embed ongoing maintenance or consumable supply agreements, the company could generate steadier cash flows and improve customer stickiness. However, this depends on the technology’s operational reliability and ease of integration into existing facility maintenance workflows. If the technology requires frequent technical support or has a steep learning curve for facility staff, service costs could offset recurring revenue benefits. Therefore, operational efficiency and customer support scalability are key levers in the business economics equation.
Defining Differentiation in a Crowded Cleaning Technology Market
CleanCore’s primary competitive advantage is its proprietary chemical-free cleaning technology, which aligns with increasing regulatory and customer demands for sustainable facility maintenance. Securing a major contract across 1,000 U.S. facilities provides both validation and a potential barrier to entry for competitors, particularly if the technology proves cost-effective and reliable at scale. However, the broader cleaning solutions market is highly fragmented, with established incumbents offering both chemical-based and emerging green alternatives.
Substitution risk is significant: facility operators may weigh cost, cleaning efficacy, and regulatory compliance when choosing between traditional chemicals, green chemical substitutes, and newer chemical-free technologies. The ability to demonstrate superior total cost of ownership, compliance benefits, and minimal operational disruption will be key to defending share. Further, network effects or lock-in could develop if CleanCore’s systems become integrated into facility workflows or if the company can offer data-driven performance monitoring, but such mechanisms are not yet established in the supplied evidence.
The competitive landscape also includes the risk of rapid technological innovation by incumbents or startups. Chemical-free cleaning technologies must continuously evolve to meet evolving regulatory standards and customer expectations on efficacy and environmental impact. CleanCore’s ability to protect its intellectual property and accelerate product development cycles will influence its sustainable competitive advantage. Moreover, partnerships with facility management companies or integration with digital facility management platforms could create network effects that enhance customer retention and could raise switching costs. Without such ecosystem embedding, CleanCore may face pricing pressure and commoditization risks in a fragmented market.
Contract Momentum and Operating Leverage Drive a Path to Profitability
The most favorable scenario sees CleanCore converting its marquee contract wins into a steady pipeline of large-scale, multi-year deals with recurring revenue components. As deployments scale, fixed costs are absorbed across a broader revenue base, unlocking operating leverage and driving margin improvement. If the chemical-free technology consistently delivers on cost, sustainability, and efficacy, customer adoption could accelerate, especially as regulatory pressure for green cleaning solutions intensifies.
Evidence that would confirm this scenario includes: disclosure of additional multi-facility contracts, a shift in revenue mix toward recurring or service revenue, and a narrowing of net losses relative to revenue growth. Announcements of new partnerships with major facility management firms or regulatory endorsements would also support the upside case.
Scaling Pains and Incremental Wins Define the Most Likely Trajectory
The most plausible outcome is that CleanCore continues to secure occasional large contracts but faces a slow climb toward profitability. Revenue growth may remain volatile if tied to large, infrequent deployment deals rather than recurring service contracts. Operating expenses are likely to stay elevated as the company invests in sales, R&D, and support to meet the demands of large enterprise clients and maintain technological differentiation.
Confirmation of this scenario would come from continued net losses despite revenue growth, limited evidence of recurring revenue streams, and the need for periodic capital raises to support operations. Incremental contract wins, modest international expansion, or new product launches may signal progress, but not yet a step-change in profitability.
Persistent Losses and Adoption Friction Threaten Sustainability
In a negative scenario, CleanCore struggles to convert its early commercial wins into a scalable, profitable business. High customer acquisition costs, slow adoption among large facility operators, or technological limitations could limit repeat business and expansion. If revenue growth stalls and losses remain high, the company may be forced to seek dilutive financing or restructure, especially as cash reserves dwindle.
This scenario would be confirmed by declining or flat revenue, persistent large net losses, failure to announce new material contracts, or signs of customer churn. Regulatory setbacks or negative performance data for the chemical-free technology would further undermine the investment thesis.
Milestones That Will Determine CleanCore’s Commercial and Financial Trajectory
Quarterly revenue growth and mix between one-off project sales and recurring service or maintenance income, if disclosed, would clarify the business model’s scalability.
Gross margin trends as deployments scale, especially as large contracts are fulfilled and operating leverage is tested.
Cash burn rate and changes in cash and cash equivalents, particularly in relation to new contract wins or major deployments.
Disclosure of additional large-scale or multi-year contracts, especially with new or repeat customers.
Evidence of customer retention or expansion (renewals, add-on sales, or references from existing clients), if disclosed.
Any regulatory approvals, certifications, or endorsements for CleanCore’s technology that would support adoption.
Updates on leadership execution—such as integration progress, operational milestones, or organizational restructuring.
Disclaimer: This is research-only, informational analysis and not investment advice. It may include AI-generated interpretation and general industry context. Always verify important details using primary sources.

Comments